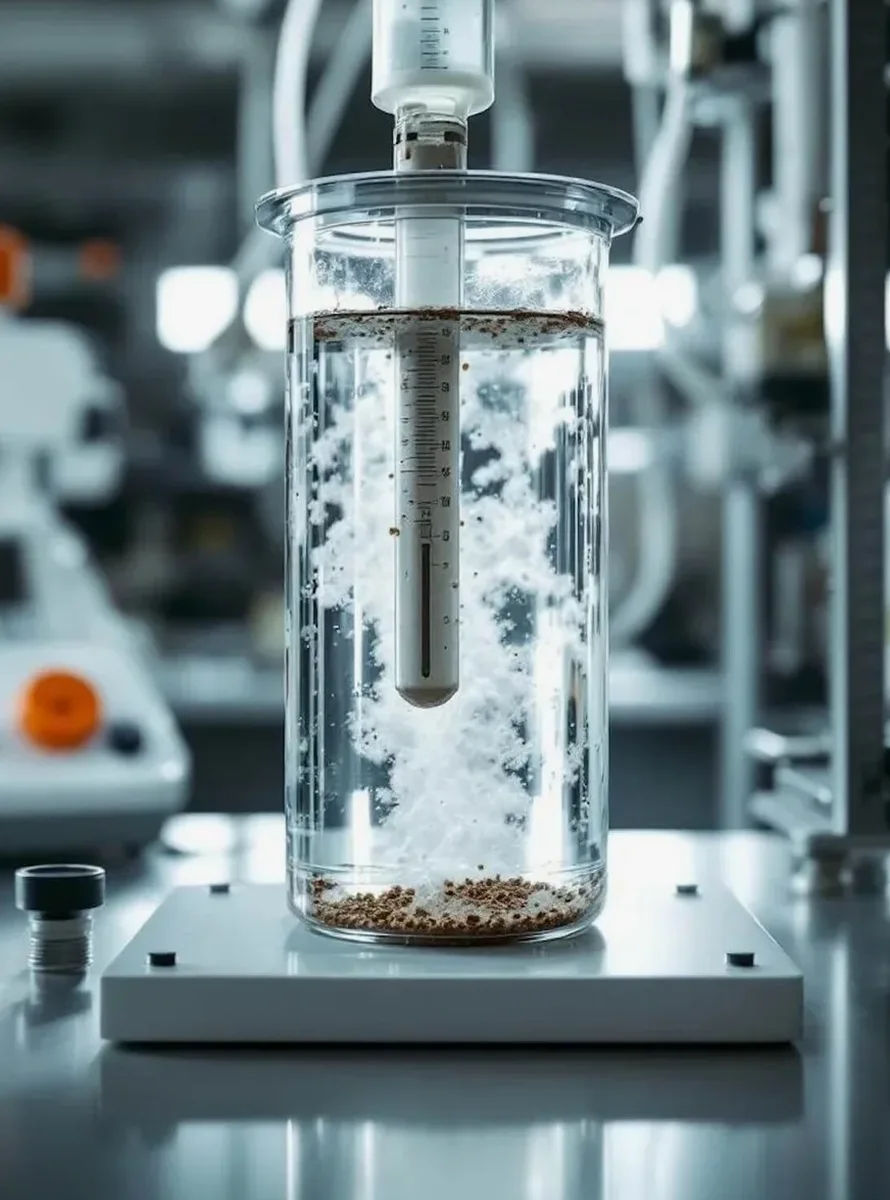
Chilliwack sits at roughly 10 m above sea level on the Fraser River floodplain, where an estimated 2–4 m of Holocene alluvium overlies glaciomarine stony clay. A single borehole can pass through peaty topsoil, silty overbank deposits, and coarse channel sand within 15 vertical feet. Grain size analysis by combined sieve and hydrometer—following ASTM D6913/D7928—resolves that entire sequence into a continuous 0.075 µm to 75 mm curve. The resulting gradation directly feeds USCS classification, internal stability checks for embankment filters, and input for seepage models under dike upgrades. Understanding the full distribution, not just the sand fraction, matters when the Atterberg limits of the fines control whether a silt is plastic enough to hold water behind a levee.
A continuous 0.075 µm–75 mm gradation curve is the single most versatile piece of data for classifying Fraser Valley soils, designing filters, and estimating hydraulic conductivity.
Our approach and scope
ASTM D6913 governs the mechanical sieve portion from 75 mm down to the No. 200 sieve, while ASTM D7928 covers the hydrometer sedimentation analysis for the silt and clay fraction. In Chilliwack, the procedure begins with oven-drying at 110 ± 5 °C, followed by careful wet-sieving to separate the minus-200 material without losing fines. The coarse fraction is shaken through a stack of 8-inch sieves selected at half-phi intervals; the fine fraction is dispersed with sodium hexametaphosphate and read with a 152H hydrometer at 0.5, 1, 2, 5, 15, 30, 60, 250, and 1440 minutes. The combined curve reveals D10, D30, D50, D60, and D85 values essential for filter design and the Hazen permeability estimate. For road subgrades on Vedder Mountain fan deposits, we often pair this with the
Proctor compaction test to link gradation directly to maximum dry density and optimum moisture content.
Frequently asked questions
What size sample do you need for a combined sieve and hydrometer test in Chilliwack?
We request approximately 500 g of material passing the No. 4 sieve for the hydrometer portion plus enough bulk sample to yield the required coarse fraction. A 20 kg bag from a split-spoon sampler or bulk excavation typically provides ample material for duplicate analysis.
How much does a combined grain size analysis cost in the Fraser Valley?
A combined sieve-and-hydrometer test in our Chilliwack lab generally runs between CA$140 and CA$260 per sample, depending on whether you need the full hydrometer sedimentation series or just a single-point determination for the fines content.
Can you run the hydrometer test on organic silts from the Chilliwack floodplain?
Yes. We first oxidize the organic fraction with hydrogen peroxide according to ASTM D7928 pretreatment procedures. This prevents flocculation and ensures the sedimentation readings reflect the true mineral particle size distribution, not organic aggregates.
How long does the full hydrometer sedimentation series take?
The standard series runs for 24 hours from the start of sedimentation, with readings taken at logarithmically spaced intervals. We report results the following business day. Rush service with a truncated 8-hour series is available when only the sand-silt cutoff is critical.
Do you provide the gradation curve in digital format for design software?
Every report includes a PDF with the semi-logarithmic plot and a CSV file with percent-passing data at all sieve and hydrometer points. The CSV imports directly into gINT, OpenGround, GeoStudio SEEP/W, and standard spreadsheet templates.