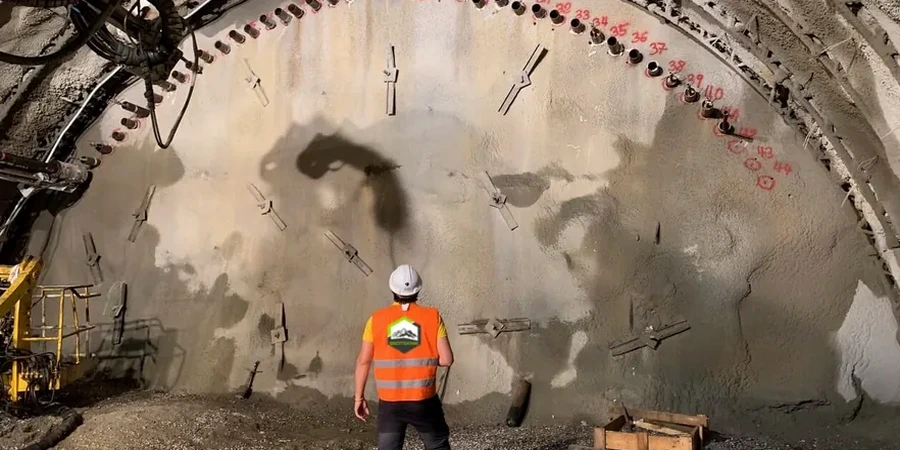
A deep excavation on Yale Road hit a pocket of silty sand at 4 meters last spring, and the shoring started talking back through the inclinometers before anyone saw a crack. The crew dialed in the readout frequency to every 15 minutes, and the numbers told us exactly when to stiffen the bracing. Chilliwack’s glacial and alluvial soils, especially near the Vedder River fan, don’t always give visible warning before they move. That’s why our monitoring program in Chilliwack doesn’t just record data—it runs against preset trigger thresholds so the superintendent gets a call the moment lateral displacement hits 50% of the design limit. For cuts deeper than 6 meters in this valley, complementing the instrumentation with a CPT test ahead of the dig helps correlate the stratigraphy to the sensor array.
Displacement doesn’t start when the wall cracks—it starts days earlier in the sensor data, and we read it before it becomes a problem.
Our approach and scope
The backbone of our setup in Chilliwack is a string of digital MEMS inclinometers grouted into the retained face, paired with vibrating wire piezometers that track pore pressure swings as the water table rises during the November rains. The datalogger on site pushes readings to a cloud dashboard every five minutes, and the office engineer can overlay the deformation curve against the excavation stage plan. We calibrate everything to the NBCC 2020 seismic hazard value for Chilliwack, which sits in a moderate zone but gets amplified in soft clay basins. Load cells on the tiebacks and strain gauges on the walers complete the picture, giving us a continuous force balance on the shoring system. When the excavation crosses the contact between the Sumas till and the underlying glaciomarine clay, the data signature changes sharply—and that’s exactly what the team is trained to catch.
Site-specific factors
The winter water table around Chilliwack can rise 2 meters in a week when the Fraser Valley gets hammered with rain, and that hydrostatic bump loads retaining walls in ways the static design doesn’t always capture. We’ve seen tieback loads spike 40% above the locked-off value during a single storm, while the inclinometer profile shifts almost imperceptibly—until you overlay the piezometer curve. If the monitoring plan doesn’t include real-time pore pressure, you’re flying blind on the biggest variable in the cut. A second risk shows up where the Sumas till lenses out and the excavation bottom sits in normally consolidated clay: basal heave can develop slowly, then accelerate without warning. Our approach in Chilliwack combines settlement points behind the wall with heave pins in the pit floor, so both sides of the stability equation are instrumented.
Frequently asked questions
What does a basic excavation monitoring package cost in Chilliwack?
A typical instrumentation program for a residential or light commercial excavation in Chilliwack falls between CA$980 and CA$3,040, depending on the number of sensors, the monitoring duration, and whether real-time telemetry is required. Deeper cuts with multiple inclinometer strings and automated alerts run toward the higher end of that range.
How often should inclinometer readings be taken during active excavation?
During active digging and bracing, we read the inclinometers at least twice daily, and switch to hourly intervals if the deformation rate exceeds 0.5 mm/day. Once the excavation reaches final grade and the permanent structure is rising, the frequency drops to weekly, but we keep the datalogger armed until backfill is complete.
Which parameters trigger an automatic alert on your system?
We set three levels: advisory at 60% of the design deflection limit, warning at 80%, and action at 100%. Alerts can also trigger on pore pressure exceeding the assumed hydrostatic profile or on tieback load loss greater than 15% of the lock-off value within 24 hours.
Can you monitor vibration from blasting or compaction near existing buildings?
Yes, we deploy triaxial geophones that measure peak particle velocity in real time, referenced to the USBM RI 8507 damage criteria or CSA A23.3 limits. The data streams to the same dashboard as the inclinometers, so the entire ground response picture is in one place.